
Understanding Complex Data, Making Informed Decisions
The MultiVarX application combines core methods of multivariate data analysis in a user-friendly and clearly structured application. This allows you to identify patterns, influencing factors, and potential risks in your datasets easily and efficiently—enabling informed decision-making while benefiting from a cost-effective licensing model.
- PCA, PLS/PLS-DA, correlation analysis, and more – multivariate data analysis out of the box
- Intuitive operating concept: multivariate statistics for beginners and experts alike
- Comprehensive analyses enabled by smart algorithms and customized visualizations of results
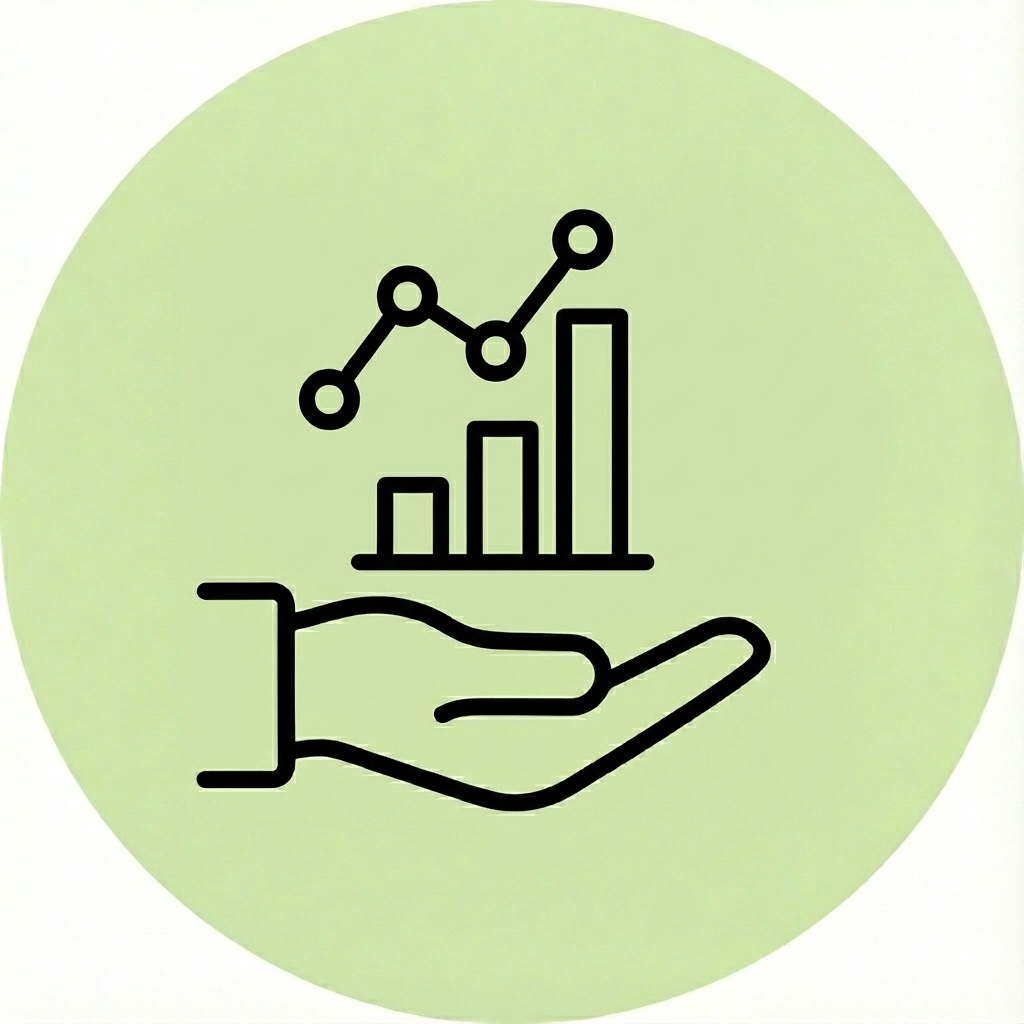
derive precise, data-driven decisions from raw data
Our application consolidates numerous features per dataset, corrects measurement and scaling effects, and makes relevant relationships visible. This accelerates testing and development cycles, avoids unnecessary additional measurements, and reduces material, personnel, and equipment costs.
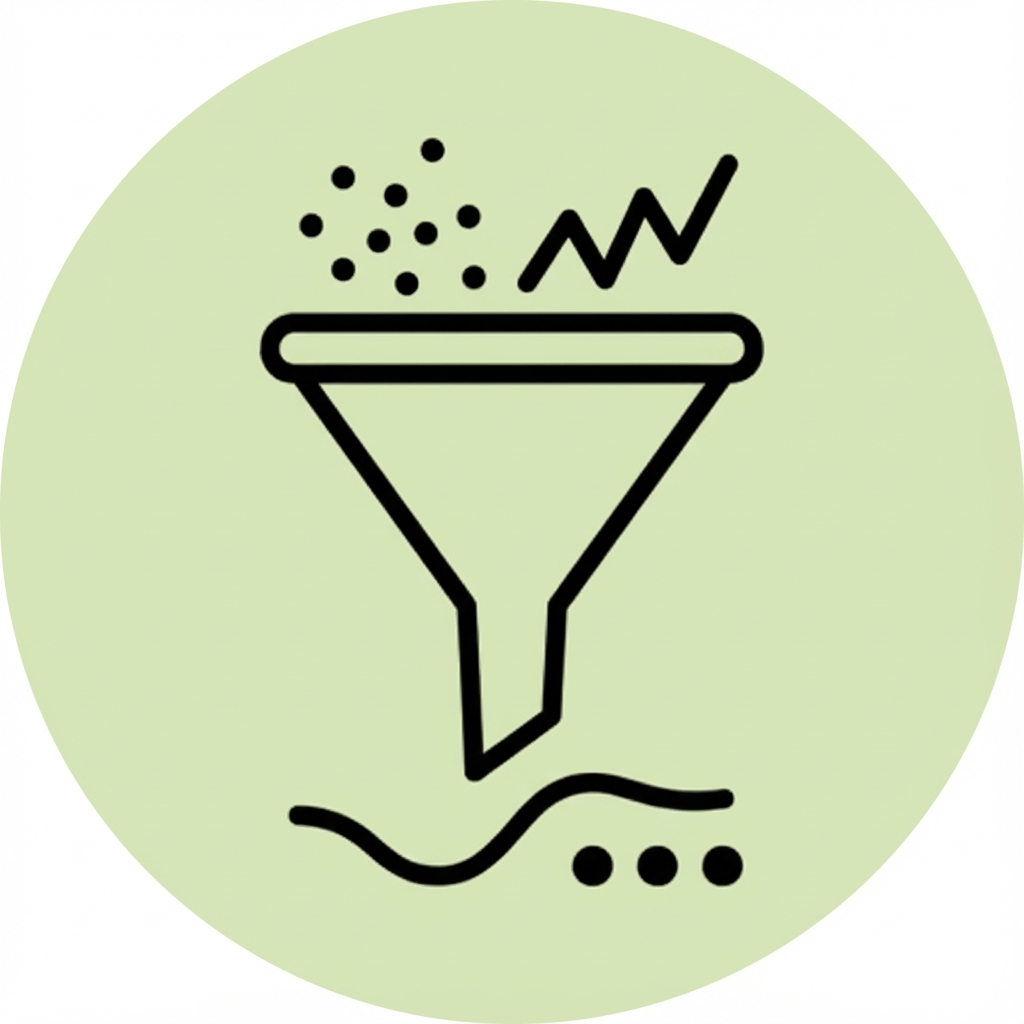
- Robust Data FoundationScaling (UV/Pareto), smoothing/derivatives (Savitzky–Golay), and scatter correction methods for spectroscopic applications (SNV/MSC) make variables comparable and reduce artifacts.
- Proven MethodologyMultiVarX uses well-established multivariate methods such as PCA and PLS as well as recognized statistical principles. Optional training/test set partitioning is performed using the Kennard–Stone algorithm. All analysis steps are transparent and based on established standards.
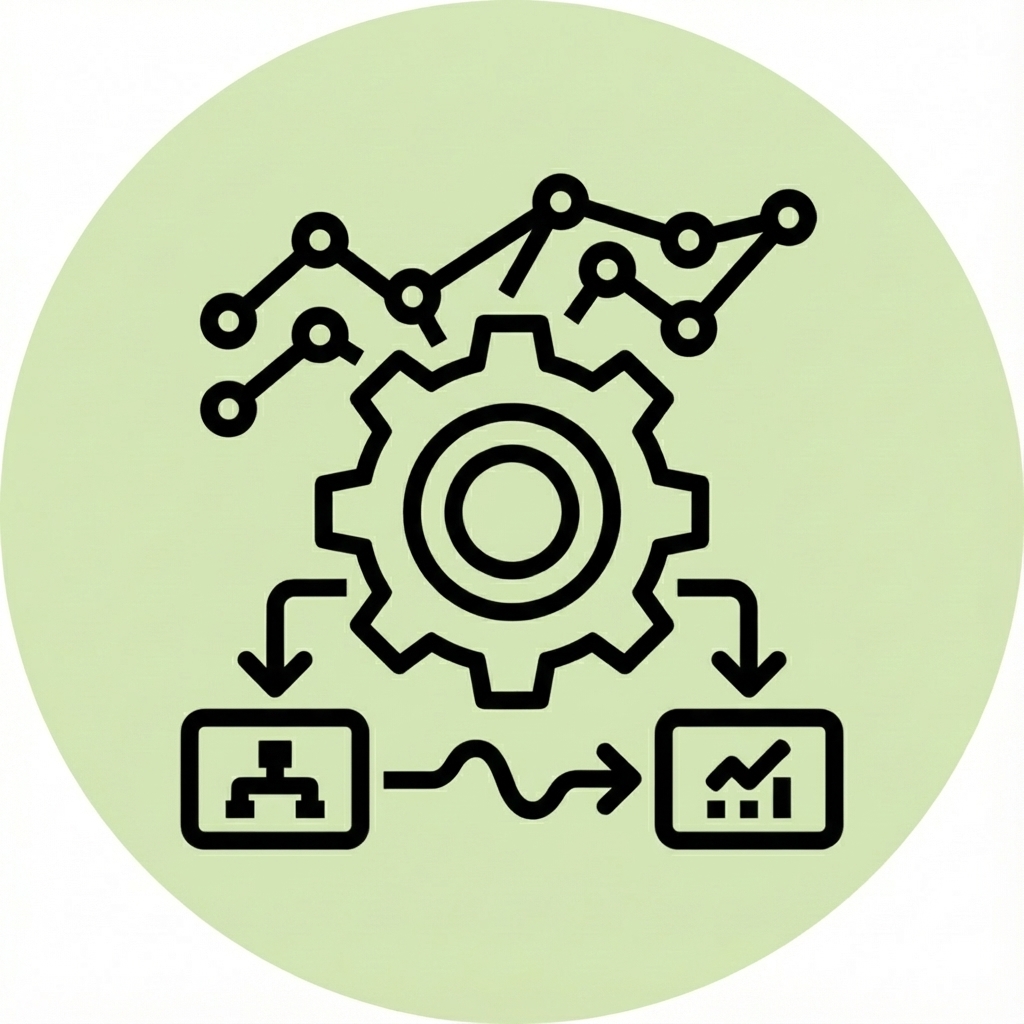
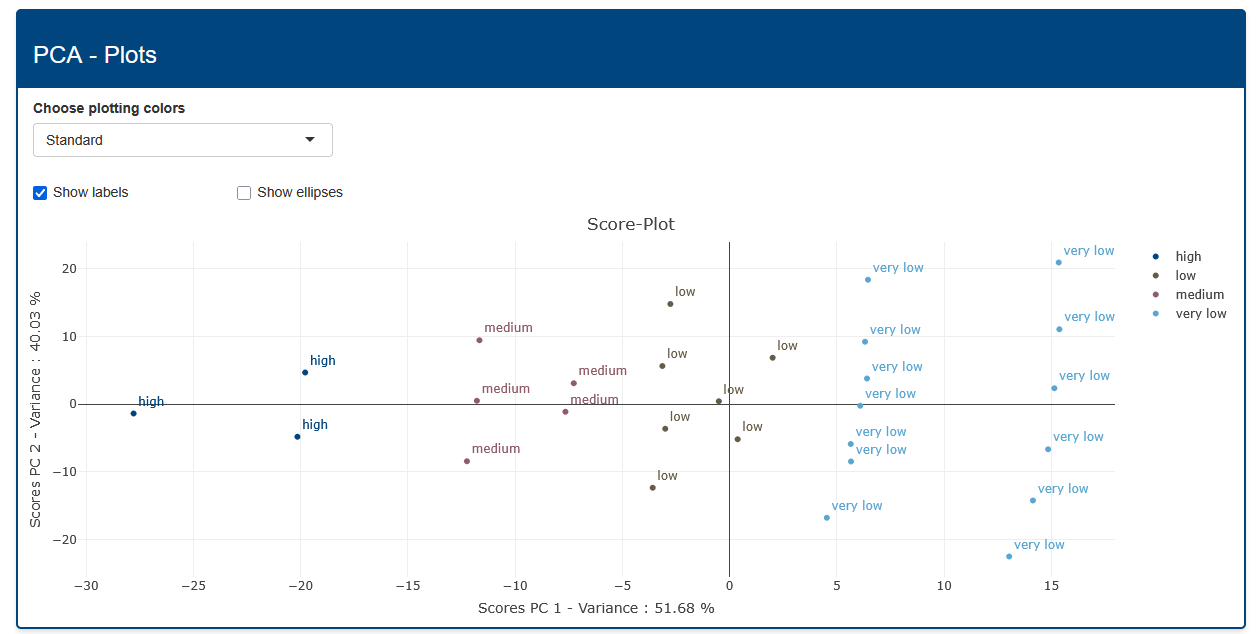
- Versatile Visualizations and Efficient Data Export for ReportingThe MultiVarX application visualizes relationships and patterns in the data using score plots, loading plots, and variable relevance diagrams. Integrated export functions allow these results to be used directly in reports, presentations, or model validation.
The MultiVarX-Workflow:
Research & Development
In R&D projects, MultiVarX helps efficiently structure and interpret complex measurement data and experimental results. Chemical, physical, or biotechnological processes can be systematically evaluated and optimized. Patterns and influencing factors become visible before time-consuming and costly experiments have to be repeated.
Process Monitoring, Quality Control & Predictive Maintenance
Monitoring of production processes and product quality, as well as forecasting maintenance requirements and early identification of potential failures through automated analysis systems and sensor data.
Analysis of Large Measurement Datasets
When many variables are observed simultaneously, MultiVarX helps make structures and relationships visible. Clusters, outliers, or hidden relationships can be quickly identified this way—even without a prior hypothesis. Ideal for understanding new datasets or unknown samples.
General Data Mining & Statistics
Pattern recognition, feature selection, classification, and model building across a wide range of application domains.

What Makes MultiVarX Special?
The application was specifically designed to meet the requirements of research and industry, enabling precise and transparent analysis of extensive measurement and process data—without technical barriers or complex operating structures.
The MultiVarX application stands out through its intuitive usability and clear user interface, allowing both beginners and experienced users to obtain reliable results with ease. A predefined workflow guides users step by step through the application, further simplifying the analysis process. The software supports a wide range of common data formats and can be flexibly integrated into existing workflows. Comprehensive visualization options make complex relationships clear and easy to interpret, while analysis results can be efficiently prepared for reports and further evaluations.
This makes our application a practical solution for anyone who needs to make data-driven decisions and analyze measurement or process data efficiently.
Frequently Asked Questions about the MultiVarX Application
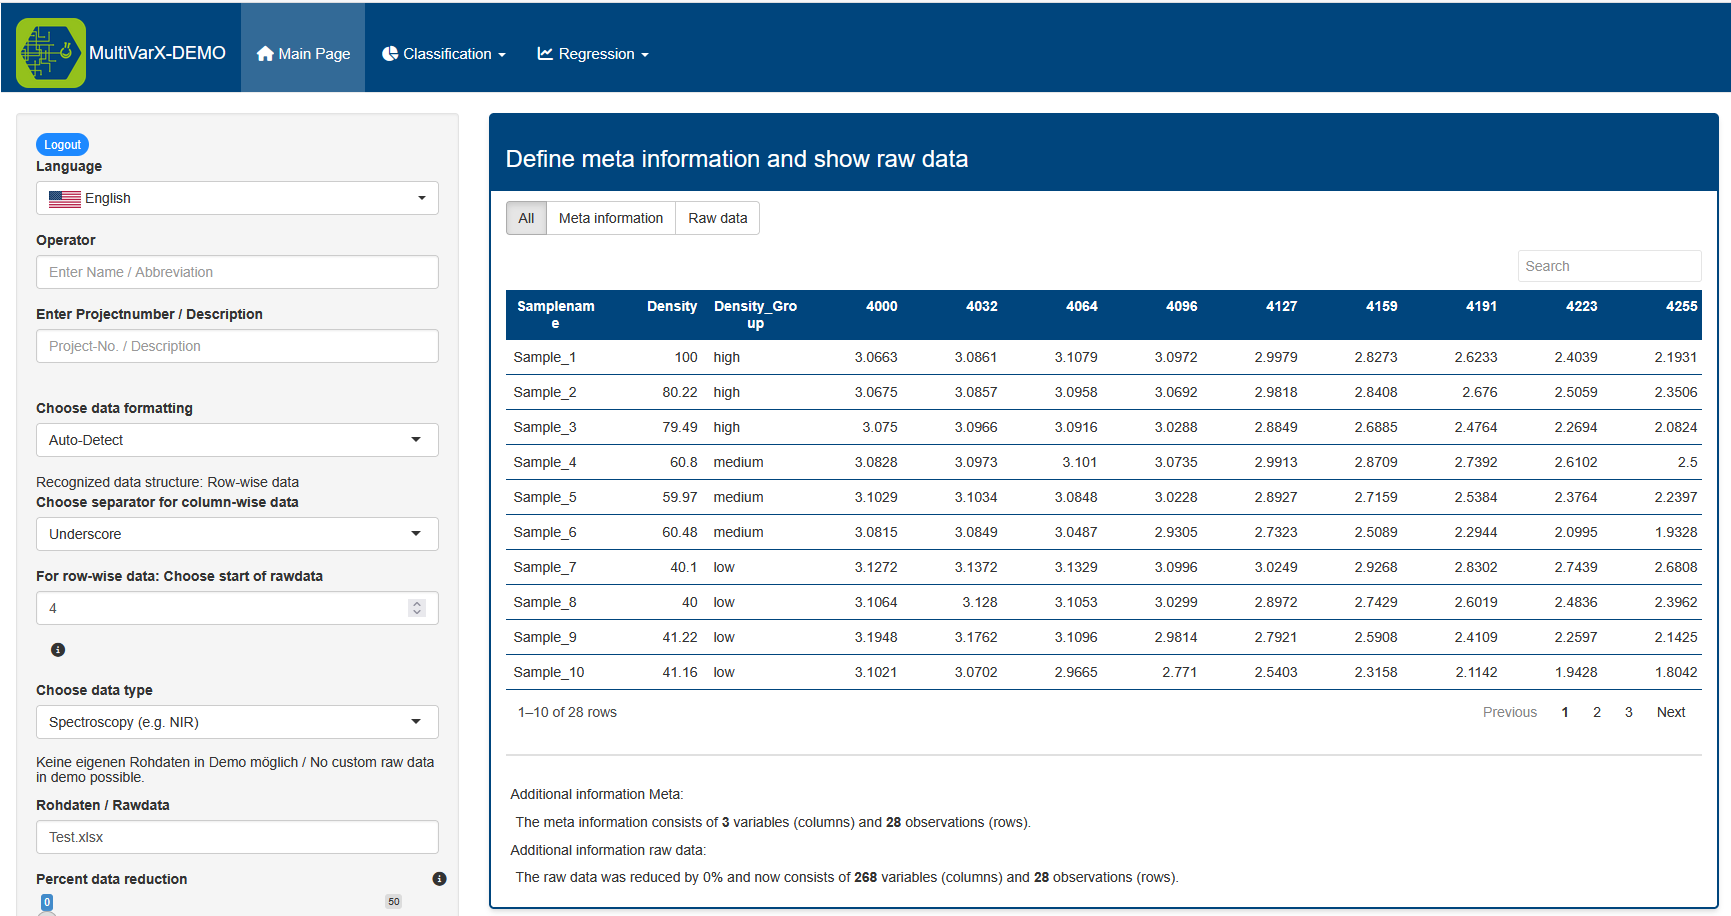
The MultiVarX application is designed for the analysis of structured, tabular datasets—for example, Excel or CSV files with multiple variables per object. It can analyze, among other things, spectral data (e.g., UV/VIS, NIR, MIR, MS), laboratory and process data, physicochemical measurement series, survey results, as well as operational and business key figures.
The MultiVarX application is designed for the analysis of structured, tabular datasets—for example, Excel or CSV files with multiple variables per object. It can analyze, among other things, spectral data (e.g., UV/VIS, NIR, MIR, MS), laboratory and process data, physicochemical measurement series, survey results, as well as operational and business key figures.
The MultiVarX application is designed for the efficient analysis of medium-sized datasets as typically encountered in research, laboratory, and production environments. This includes data structures ranging from several dozen to several thousand measurement points.
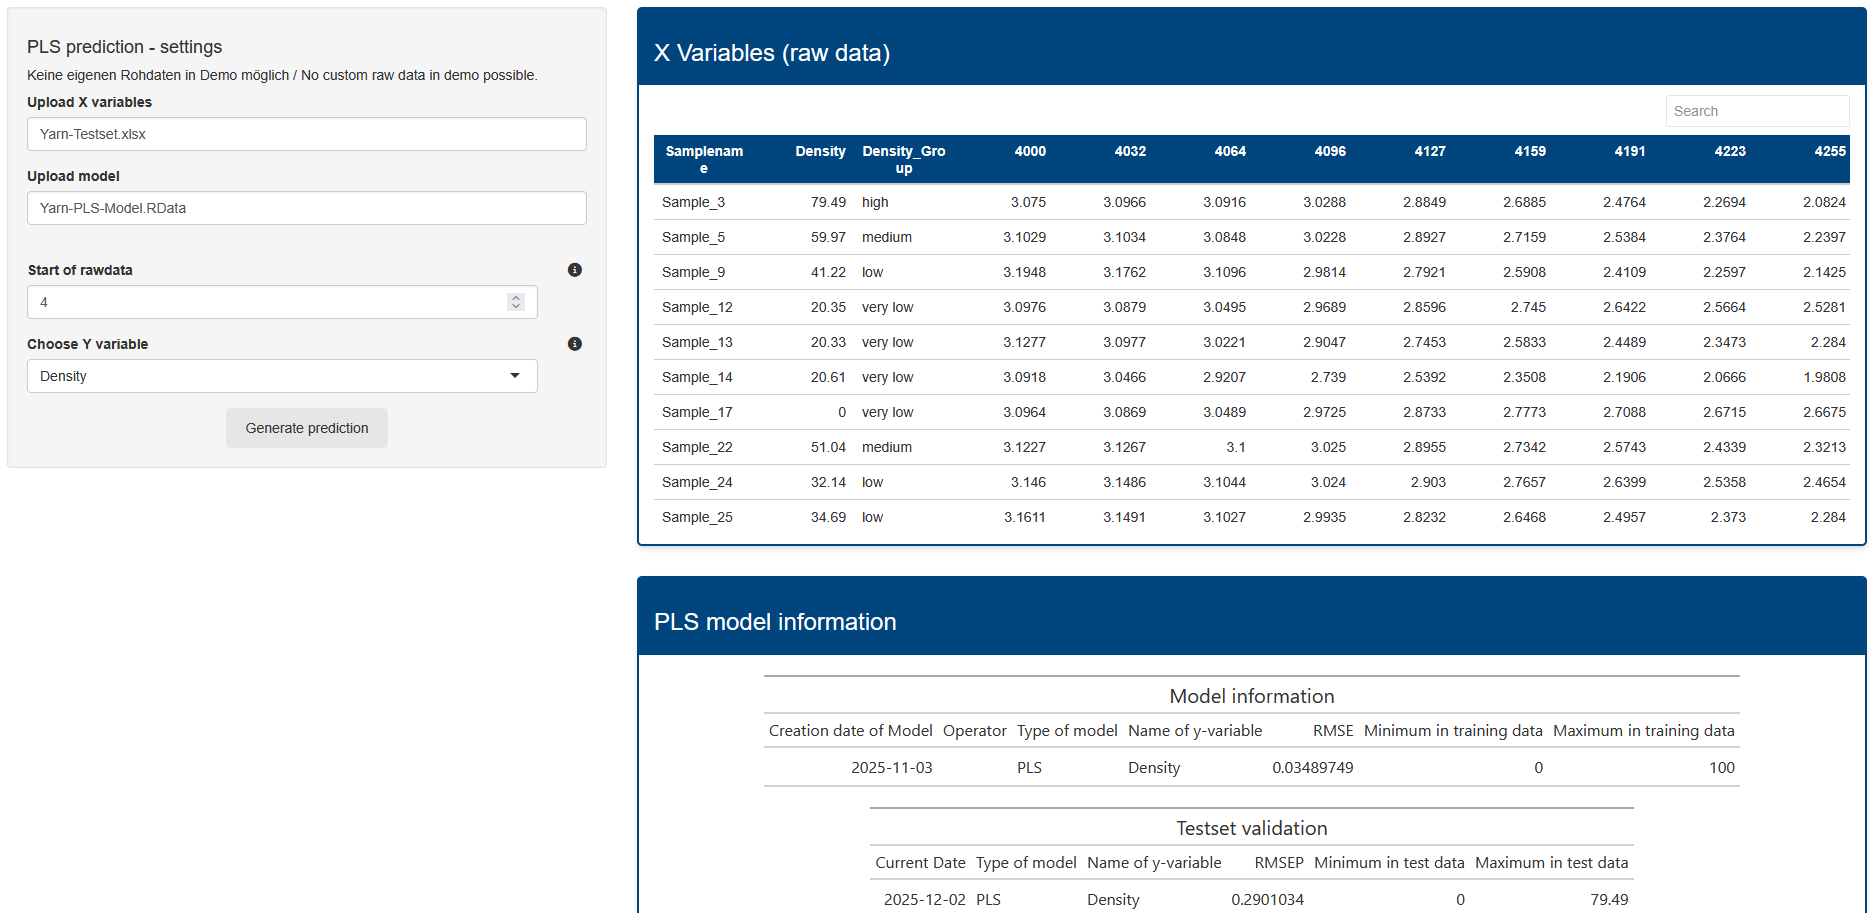
Currently, PCA (Principal Component Analysis), PLS and PLS-DA (regression and classification), as well as correlation analyses with heatmaps are available. All methods can optionally be combined with suitable preprocessing steps, such as UV/Pareto scaling, Savitzky–Golay smoothing, or SNV/MSC correction.
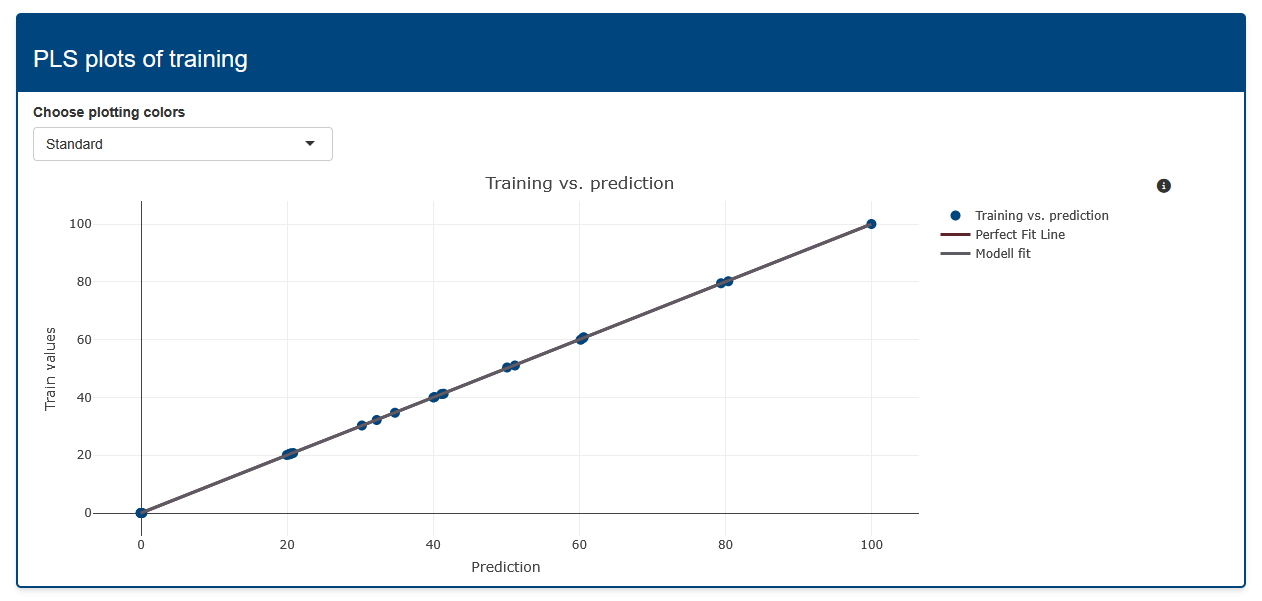
With the MultiVarX application, you receive clear score, loading, and correlation plots that enable the identification of groups, trends, and outliers in the data. In addition, PLS analyses allow models to be built that can be applied to new datasets—for example, to predict concentrations, quality parameters, or class membership.
Yes, the application is equally designed for use in both research and industry.
The software is used in areas such as research and development, quality control, and process monitoring. It is suitable for laboratory, production, and field applications as well as for academic projects and student work. This makes MultiVarX a flexible solution for a wide range of requirements in science and practice.
For using the MultiVarX application, annual, three-year, and student licenses are available. Licenses are issued on a per-user basis, meaning each user requires their own license—regardless of whether they are a beginner or an expert. Upon request, we are happy to provide a customized offer.